Simulation & Analytics

Operational decisions shown in probability of $ return.

RTOP, our simulation and analytics platform, turns operational data into the next decision. Ten years in production.

Operational outcomes

One platform. Three outcomes operators run it for.

03

Hold the limits while you optimize

Constrained optimization keeps operations inside product spec, emissions and water limits while margin improves — and supports the reporting behind them.

Engagement Quality-spec adherence improved

What it looks like

Every option priced, not just the ones someone thought to try.

Engagement output — blend scenarios
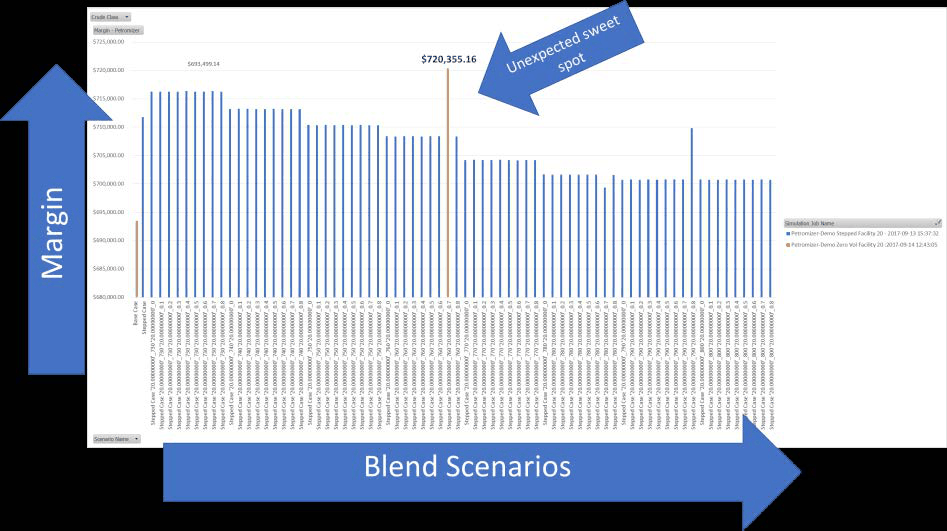
Bar chart of margin per blend scenario across roughly seventy simulated cases, with the baseline case marked at the left and a single higher-margin outlier highlighted mid-range.
Margin across every blend scenario evaluated. The operator's baseline sits at the left; the higher-margin case the automation surfaced sits mid-range, in a region nobody had reason to test by hand. Read the engagement

What you get

It runs in your environment, not ours.

  • Output in the tools you already run

    Tableau, Power BI, Spotfire, Excel, R and Python. No extra dashboard to learn or licence.

  • Models that run on your schedule

    Against live operational and financial data, not an extract that has drifted.

  • Connection to systems of record

    Historians, SCADA, ERP and finance systems, so the economics travel with the decision.

  • An audit trail behind every number

    Inputs, constraints and scenarios retained — the answer is on file before anyone asks.

$1.5B+

in client decisions analyzed through RTOP, worldwide. 10+ years in production.

About RTOP

Have a problem worth engineering?