
From Data to Decisions — From Ideas to Impact
Operational decisions you can defend.
RTOP combines physics-based models, operational data and AI, running thousands of scenarios per decision.
- 10+ yrs
- RTOP in production
- $1.5B+
- Client decisions analyzed
Built and supported by R2. Deployed where it creates measurable operational value.
Capabilities
Five things RTOP does.
- 01
Predict before it breaks.
Physics-informed predictive models for production, equipment failure, and anomaly detection — validated against real intervention histories.
Stop reacting. Start predicting.
- 02
Run thousands of scenarios.
Stochastic scenario engine generates thousands of candidate operating strategies for each major decision. Probabilistic economic, operational, and reliability inputs. Defensible — not deterministic guessing.
1k–10k scenarios per decision.
- 03
Lower operating costs.
Tune chemical use, equipment cycles, fleet routing, and workflows. RTOP finds the bottleneck and shows how to clear it.
Improvement quantified per engagement.
- 04
Connect operational silos.
RTOP can integrate data from 50+ operational, financial, and enterprise sources — SCADA, historians, ERP, and finance systems — into a single defensible model. RTOP integrates with the systems your engineering and operations teams already use.
One model, all your silos.
- 05
Make decisions you can defend.
Full audit trail. Every recommendation traceable to inputs, constraints, and scenarios evaluated. When auditors ask why a decision was made, RTOP provides the evidence trail.
Defensible — to ops, finance, and audit.
How it works
See it work.
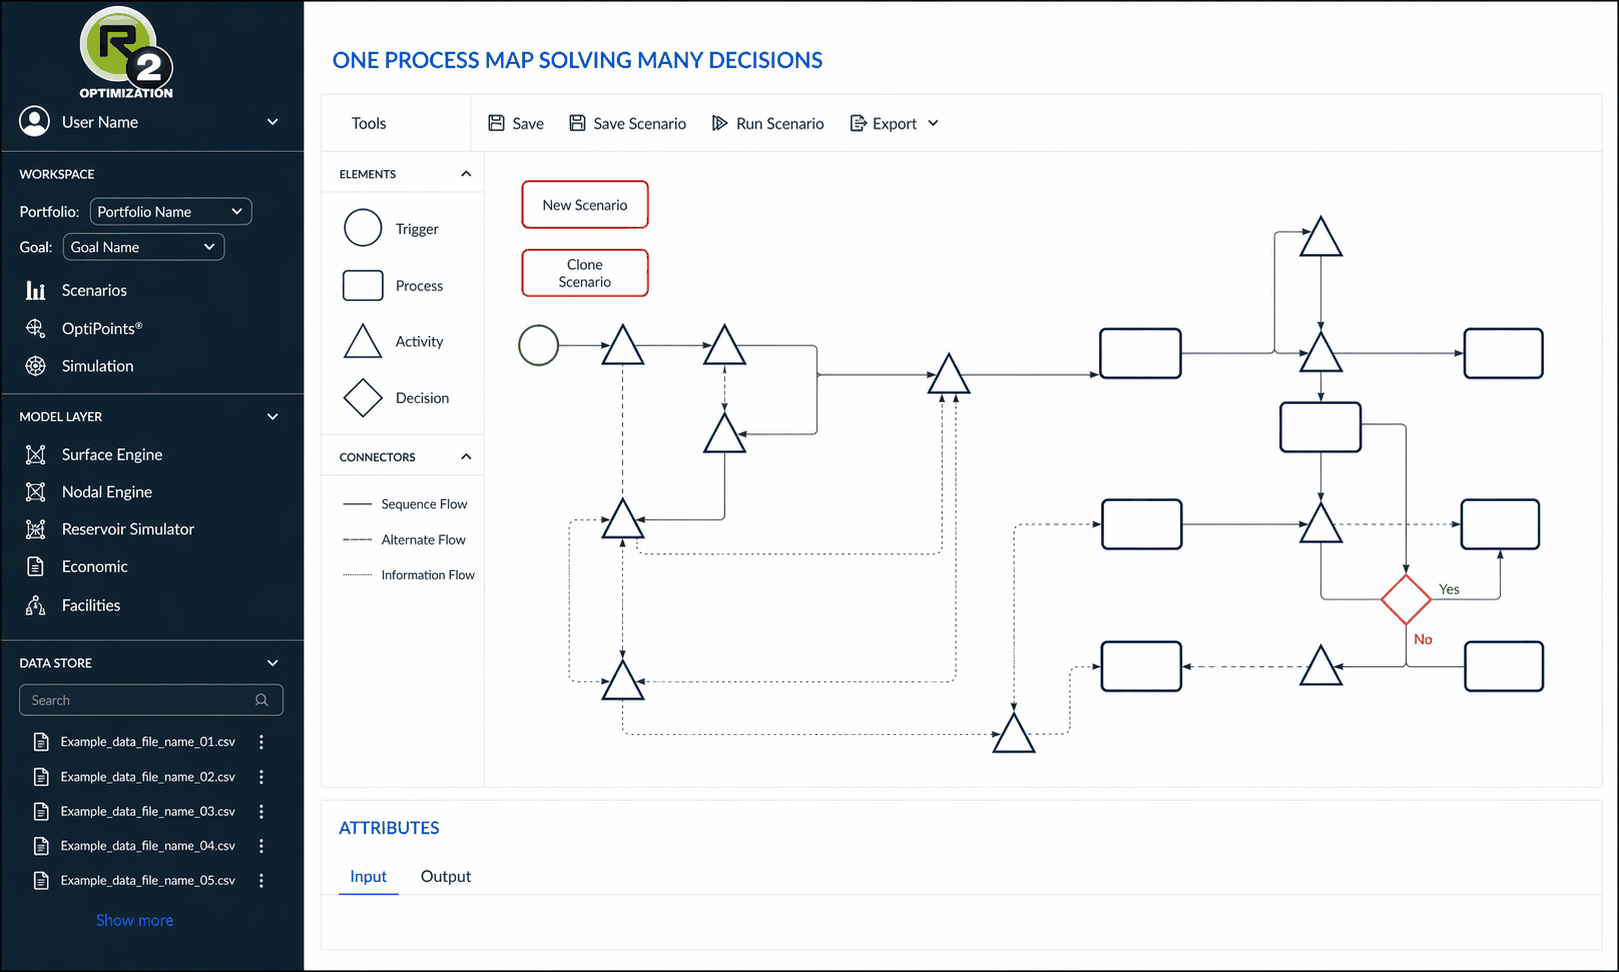
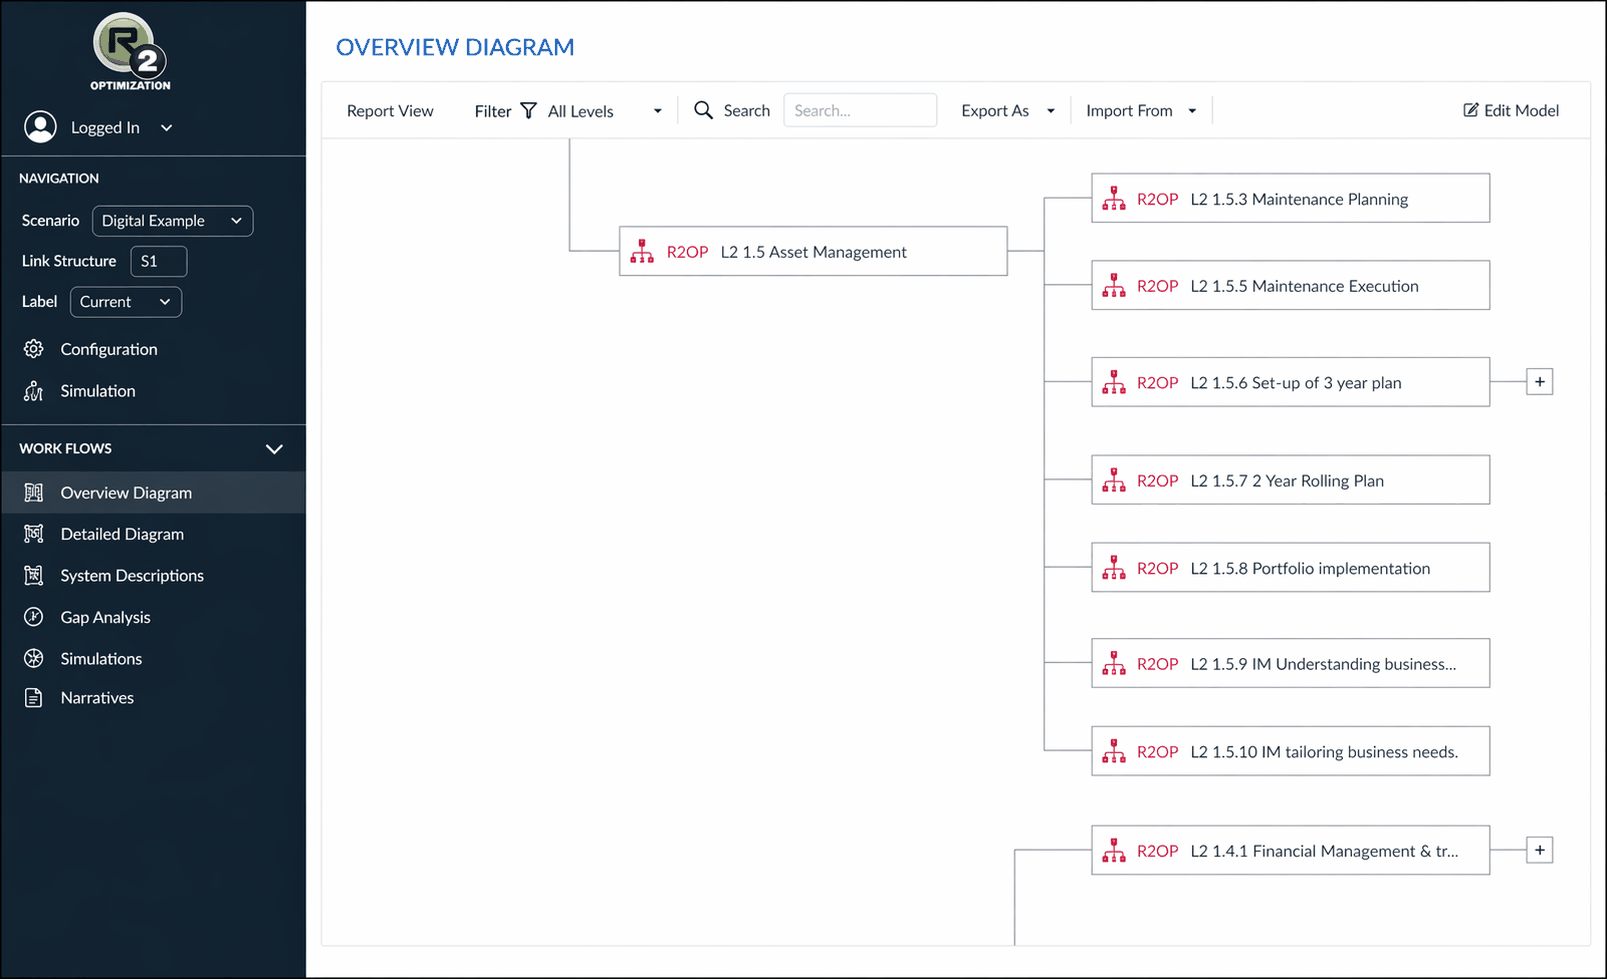
RTOP holds enterprise workflow structure and surfaces what’s live.
RTOP interface — process map
RTOP interface — overview diagram
Structure & logic
How it reasons.
Integrations
Lands in the tools your team already opens.
Output lands in the tools your team already opens — no extra dashboard tax.
Operational
- Historians
- SCADA
- Process data
Financial & enterprise
- ERP systems
- Finance systems
Data & scripting
- Spreadsheets
- Analytics languages
Dashboarding
- BI platforms
- Dashboards
Financial integration
RTOP prices every scenario from the finance systems of record — cost, capital and revenue structures pulled live, not a spreadsheet copy that drifted three quarters ago.
R2 IP
The parts we built ourselves.
The algorithms R2 wrote — what the platform contributes that an integration layer alone would not.
- Stochastic scenario generation
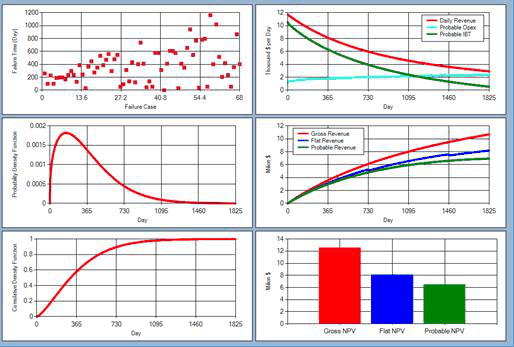
- Weibull economics
- Failure prediction
- Allocation
- Fixed / variable cost modelling
- NPV economics
Engagement output — Weibull economics
Outcomes
Evidence, not promises.
$1.5B+
In client decisions analyzed through RTOP, worldwide.
10+ yrs
RTOP in continuous production with operating clients.
50+
Operational, financial, and enterprise data sources integrated.
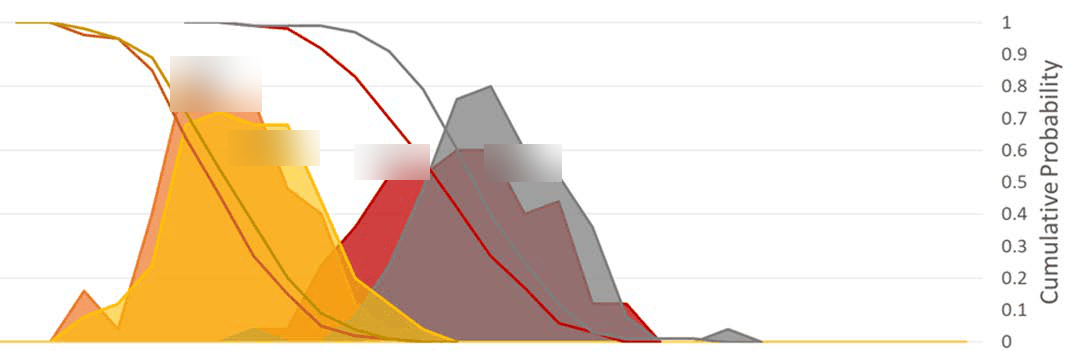
Engagement output — plan optimization
AI strategy
Where RTOP fits in your AI strategy.
Scoping Layer
InputsBusiness ProcessesOutputs- Map enterprise
- Identify constraints
- Define decision variables
AI Analysis Layer
RTOPIntegrator & Analyzer
AI-driven analysis across the models.
Generate ScenariosRun SimulationsAnalyze ResultsEnterprise Decision OptimizationModel & Data Foundation
- Reservoir Model
- Injection Model
- Surface Network
- Economic Model
RTOP Data Integration
SCADA · Field tickets · Production · Regulatory
Typical Outcomes
1,000–10,000 scenarios evaluated · 50+ integrated data sources · Faster strategic decisions
Optimal Operating Strategy
ProductionMarket StrategyProfitability
What the AI does
-
Searches the scenario space
Thousands of candidate operating strategies per decision — more than a team can walk by hand.
-
Ranks what it finds
Outcomes ordered on NPV and risk-adjusted return, with the inputs behind each one retained.
-
Flags the anomalies
Deviation from operating history surfaced against the models, not against a threshold someone guessed.
What it doesn’t
-
Replace the physics
Reservoir, hydraulic, process and economic models stay deterministic and validated against real history.
-
Invent the constraints
Capacity, regulatory and operational limits come from your engineers. RTOP optimizes inside them.
-
Make the call
Every recommendation gets engineering review before it leaves R2.
12+ proprietary algorithms 50+ integrations 6 R2-IP disciplines See what’s inside
Process
From problem to physics to decision.
The five-stage delivery sequence R2 has refined across ten years of RTOP deployments.
-
01
Scoping
Problem definition, decision variables, and constraint mapping with your engineers.
-
02
Data Integration
Plug into the data and tools you already use. SCADA, ERP, financials, historical archives.
-
03
Physics-Based Models
Build the underlying physics, hydraulics, economics, and reliability models. The foundation RTOP draws on.
-
04
Scenario & Optimization Engine
Run thousands of scenarios with probabilistic inputs. Rank outcomes on NPV and risk-adjusted return.
-
05
Analysis & Monitoring
AI-driven analysis across the model outputs. Continuous monitoring, anomaly detection, decision support.
Demo
See RTOP on your data.
30 minutes with an R2 engineer. Bring a real operational question; we’ll show you what RTOP would surface.